
Turn CSV and Excel files into interactive BI dashboards
Uploads a spreadsheet and gets an interactive dashboard, anomaly flags, a guarded forecast and traceable plain-English Q&A over the data.
1.0.0Add to Favorites
Why it matters
Transform raw business spreadsheets into decision-ready intelligence by automatically detecting schema, calculating trends and anomalies, generating forecasts, and answering plain-English questions-all without configuration or sending raw data to external models.
Outcomes
What it gets done
Detect metric, date, and segment columns from uploaded CSV or Excel files and clean data automatically
Flag anomalous periods, project baseline forecasts with uncertainty bands, and identify material drivers
Answer natural language questions about the data with visible pandas calculations and query plans
Generate interactive Plotly dashboards with drill-down, movement waterfalls, and prioritized recommendations
Source
Get it from source
Spark does not host a copy of it.
Open sourceReports
Agent outcome reports
No reports yet
Overview
Automated Data Analyst
ADA is an open-source automated data analyst that turns an uploaded CSV or Excel file into an interactive dashboard with anomaly detection, a backtested forecast, and plain-English Q&A - every calculation is deterministic and shown, with an optional AI layer that never sees raw uploaded rows. Use it when you need a decision-ready dashboard and auditable answers from a business spreadsheet without configuring a BI tool; it centers on single-file, metric/time/segment-shaped data rather than open-ended unstructured analysis.
What it does
ADA is an open-source automated data analyst for operators who need answers from a spreadsheet without configuring a BI tool. Upload a CSV, XLSX, or XLSM file and ADA cleans it, detects its business schema, builds an interactive Plotly dashboard, flags anomalous periods, projects a guarded baseline forecast, explains material changes, recommends what to investigate next, and answers plain-English questions about the data with the calculation shown behind every reply. It's designed for a simple goal analytics software often makes hard: even a first-time user should be able to upload a spreadsheet and understand what's happening in the business.
ADA keeps four layers explicit rather than collapsing everything into generated prose: a Calculation layer (deterministic, traceable detection of trends, drivers, anomalies, concentration, relationships, exceptions, and data quality issues), a Conversation layer (plain-English questions turned into auditable pandas query plans executed locally, so every answer shows its math), an Interpretation layer (calculations turned into prioritized investigations, clearly labeled and never presented as causal proof), and an Optional AI layer (plans queries the deterministic parser can't read, and writes a strategic read over already-computed evidence - opt-in, and raw uploaded rows are never sent to it). The deterministic product is fully authoritative whether or not a model is configured at all.
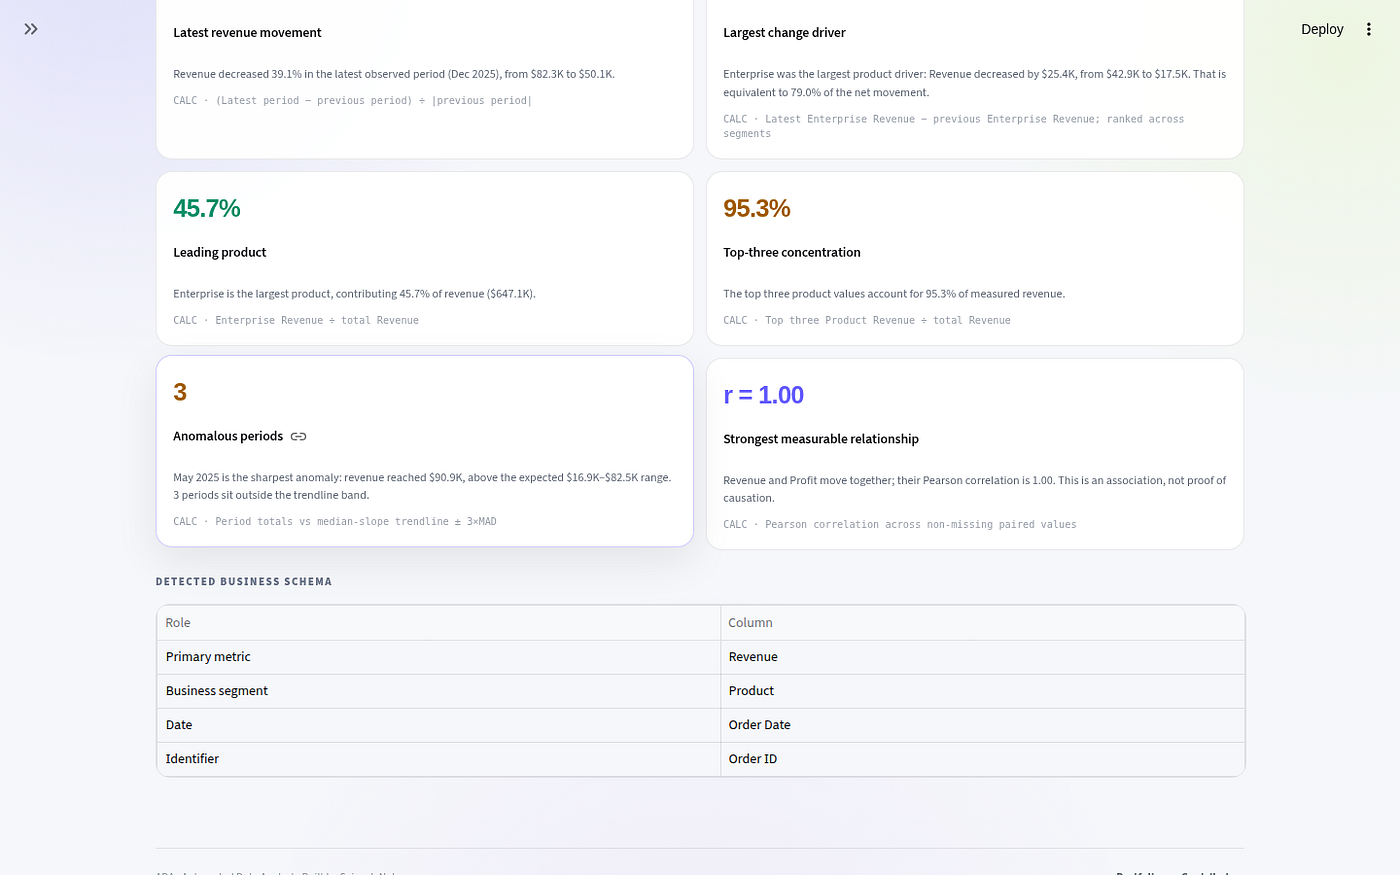
Schema detection automatically looks for a primary outcome metric (revenue, sales, profit, cost, amount, units), a time field (for period movement, anomaly detection, and forecasting), a useful segment (product, category, channel, region, customer, status), identifiers, missingness, outliers, concentration, and numeric relationships - and users can override the detected metric, date, or segment without rebuilding the dashboard, or drill the whole analysis into a single segment slice and watch it regroup by the next useful dimension. Product capabilities include an anomaly radar (periods outside a robust trendline band, flagged on the chart, in the evidence ledger, and in recommendations), a guarded baseline forecast with month-of-year seasonality, an uncertainty band, and its own backtested error printed alongside the chart, a movement waterfall reconciling the latest change by segment, a segment-by-period intensity heatmap, conservative cleanup with a visible cleaning audit, an executive headline with four business KPIs, and a downloadable Markdown executive brief plus cleaned CSV.
When to use - and when NOT to
Use ADA when you have a business CSV or Excel file and want a decision-ready dashboard, anomaly detection, and a forecast without modeling data in a traditional BI tool or trusting an unverifiable chatbot summary of your spreadsheet - it works fully with zero configuration and no API key, computing everything locally with pandas. It's particularly suited to operators who want every number backed by a visible calculation, and who need the analysis to stay authoritative and auditable rather than dependent on an LLM's own reasoning.
It's not built for arbitrary open-ended chat about unstructured data, and it's not a replacement for a full BI platform if you need deep custom modeling across many linked tables - ADA works from one uploaded file at a time (with multi-sheet Excel worksheet selection) and centers on business-metric-shaped data (an outcome, a time dimension, and a segment). The optional AI layer only activates when the deterministic query parser can't read a question, or for a higher-level strategic narrative, and even then it only ever sees schema and computed evidence, never uploaded rows or cell values.
Inputs and outputs
Input is a CSV (comma, semicolon, or tab delimited), XLSX, or XLSM file uploaded through the Streamlit interface, with a worksheet picker for multi-sheet workbooks. Run locally:
git clone https://github.com/saineshnakra/automated-data-analyst.git
cd automated-data-analyst
python -m venv .venv
source .venv/bin/activate
python -m pip install -r requirements.txt
streamlit run app.py
Output is an interactive dashboard (charts, anomaly markers, forecast band, movement waterfall, segment heatmap), an evidence ledger showing the calculation behind every displayed signal, prioritized recommendations linked to that evidence, plain-English answers to typed questions (with their pandas calculation shown), and a downloadable Markdown executive brief plus cleaned CSV. No secret is required to run it; supplying your own API key unlocks the optional AI layer described above.
Integrations
ADA's core analysis runs entirely on pandas and Plotly with no external service dependency. Its optional AI layer calls OpenAI's Responses API for two narrow, typed purposes: a query planner (invoked only when the deterministic parser can't read a question; it receives the column schema and the question, returns a proposed query plan, and ADA executes that plan locally, refusing unresolvable plans rather than guessing) and a strategic read (receiving only the calculated schema, summaries, evidence cards, and recommendations - never raw rows). No specific model or provider is fixed by default; each AI call waits for your confirmation before it runs, so nothing is triggered or spent without review. It deploys as a standard Streamlit app to any Python host.
Who it's for
Operators, analysts, and small teams who need answers from a business spreadsheet without configuring a BI tool or trusting an opaque chatbot summary, and developers who want a working, tested example of a deterministic-first analytics engine with a narrowly-scoped, privacy-conscious optional AI layer that never sends raw data to a model. It is licensed under MIT.
Source README
ADA: Automated Data Analyst



Upload a CSV or Excel file. Get a dashboard, an executive brief, anomaly
flags, a forecast, and answers to plain-English questions - with the calculation
shown under every number.
Live demo ·
Documentation ·
Roadmap ·
Contributing
Source: github.com/saineshnakra/automated-data-analyst
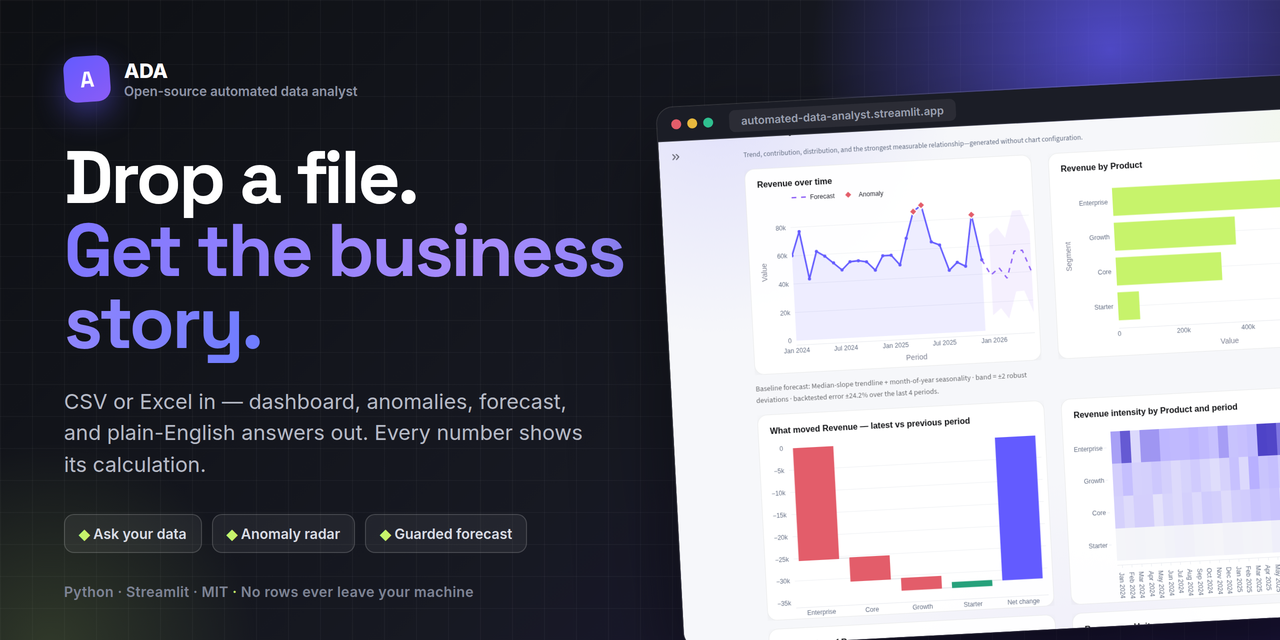
What it does
ADA reads your file, works out which column is the metric, which is the date,
and which is the segment, then builds the analysis around that.
- Dashboard - trend, segment breakdown, movement waterfall, segment × period heatmap
- Ask ADA - plain-English questions answered locally with pandas, calculation shown
- Anomaly flags - periods outside a calibrated band, sized so a stable series false-alarms about once in twenty analyses
- Forecast - a guarded baseline that refuses to run on thin history and reports when it was no better than assuming no change
- Evidence and next steps - every finding carries its calculation; recommendations are labelled as interpretation, never as cause
- Downloads - Markdown executive brief and cleaned CSV
Limits: 25 MB per file, 250,000 rows analyzed. Formats: .csv, .xlsx, .xlsm.
Nothing to upload? Try a sample
Pick Try a sample dataset in the app, or download one from samples/:
| Sample | What it shows |
|---|---|
| SaaS subscriptions | A real revenue drop the anomaly radar finds, and a forecast that beats no-change |
| Support tickets | No revenue column, and a forecast honest enough to say it is useless |
| Ecommerce orders | Returns as negative rows, so totals cope with mixed signs |
All three are synthetic, so they carry no privacy or licensing baggage.
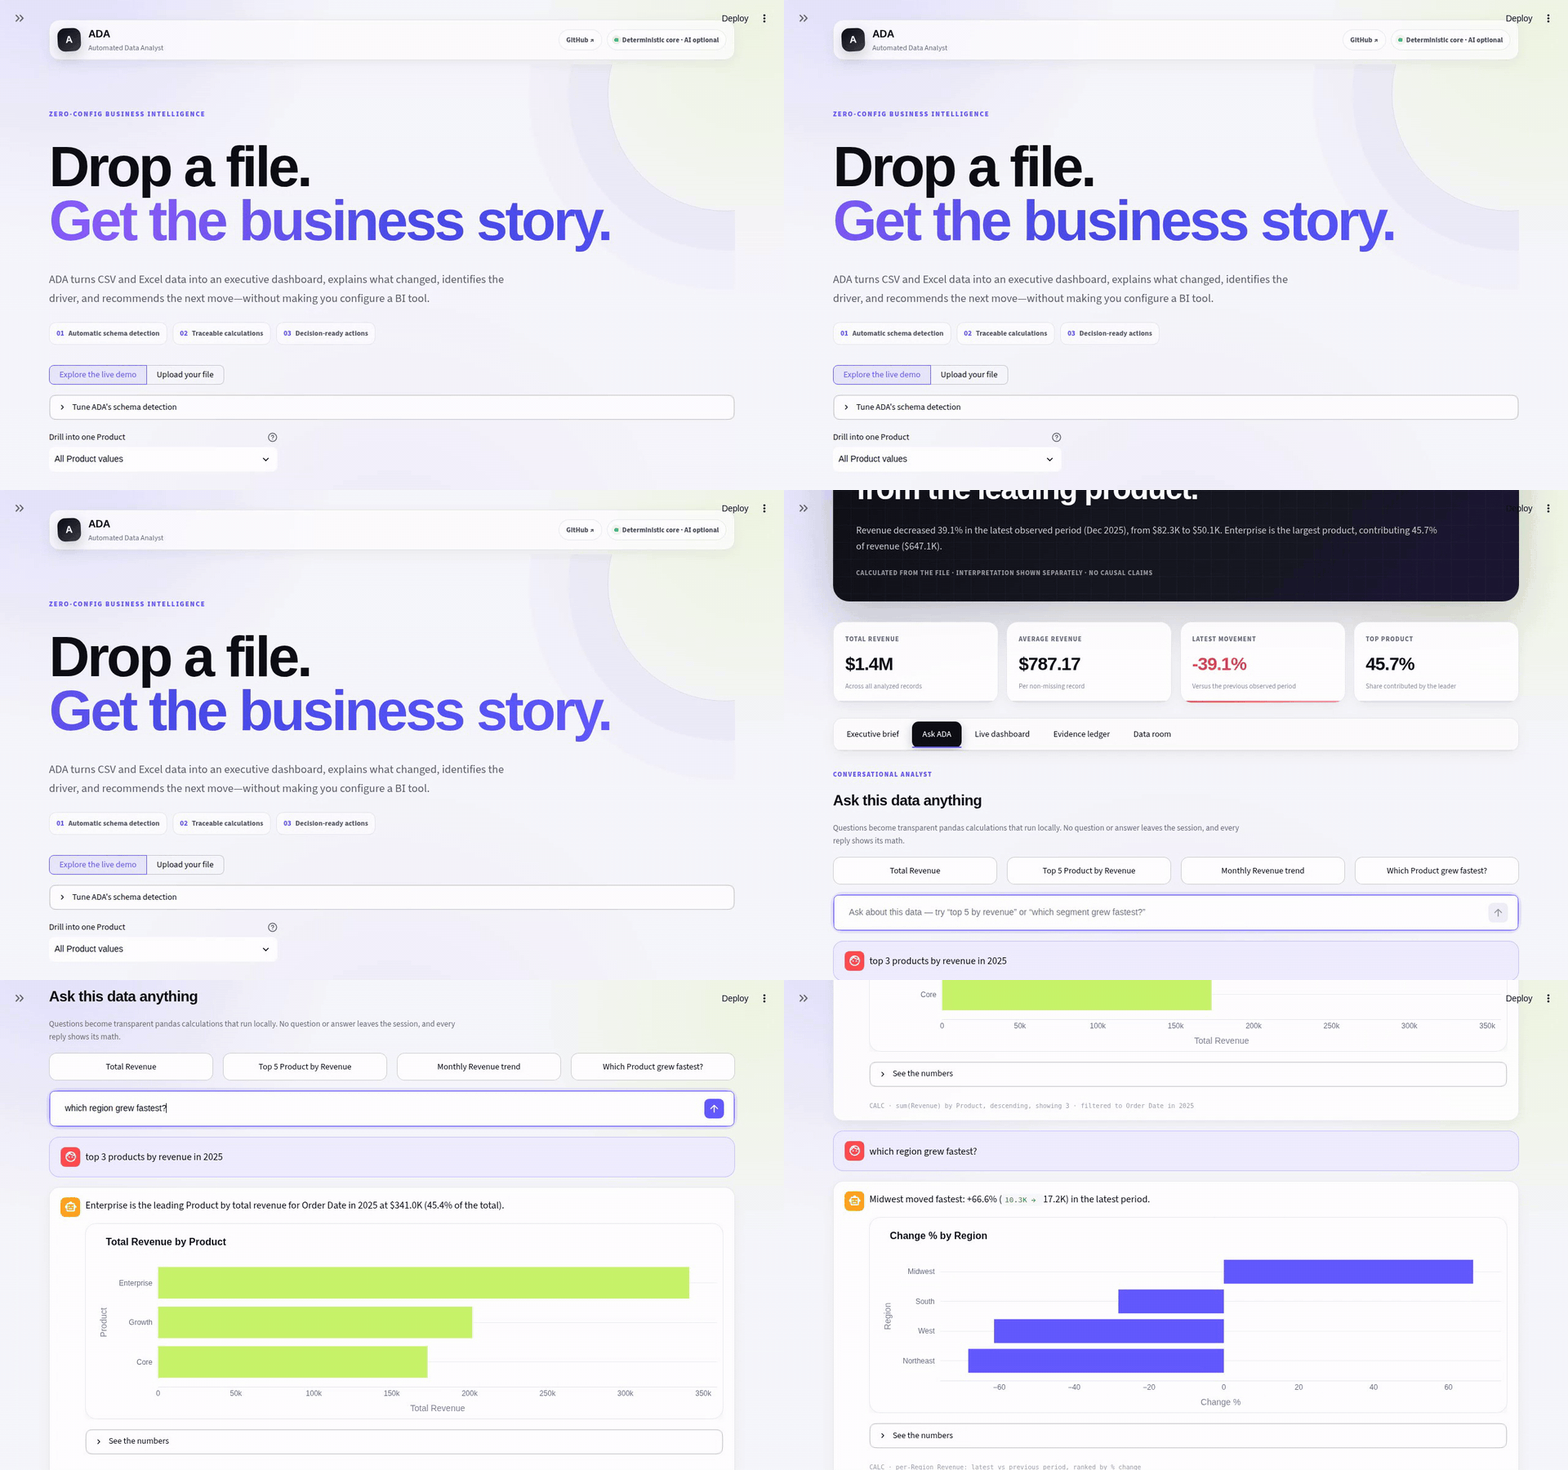
Ask a business question. Get the number and its calculation.
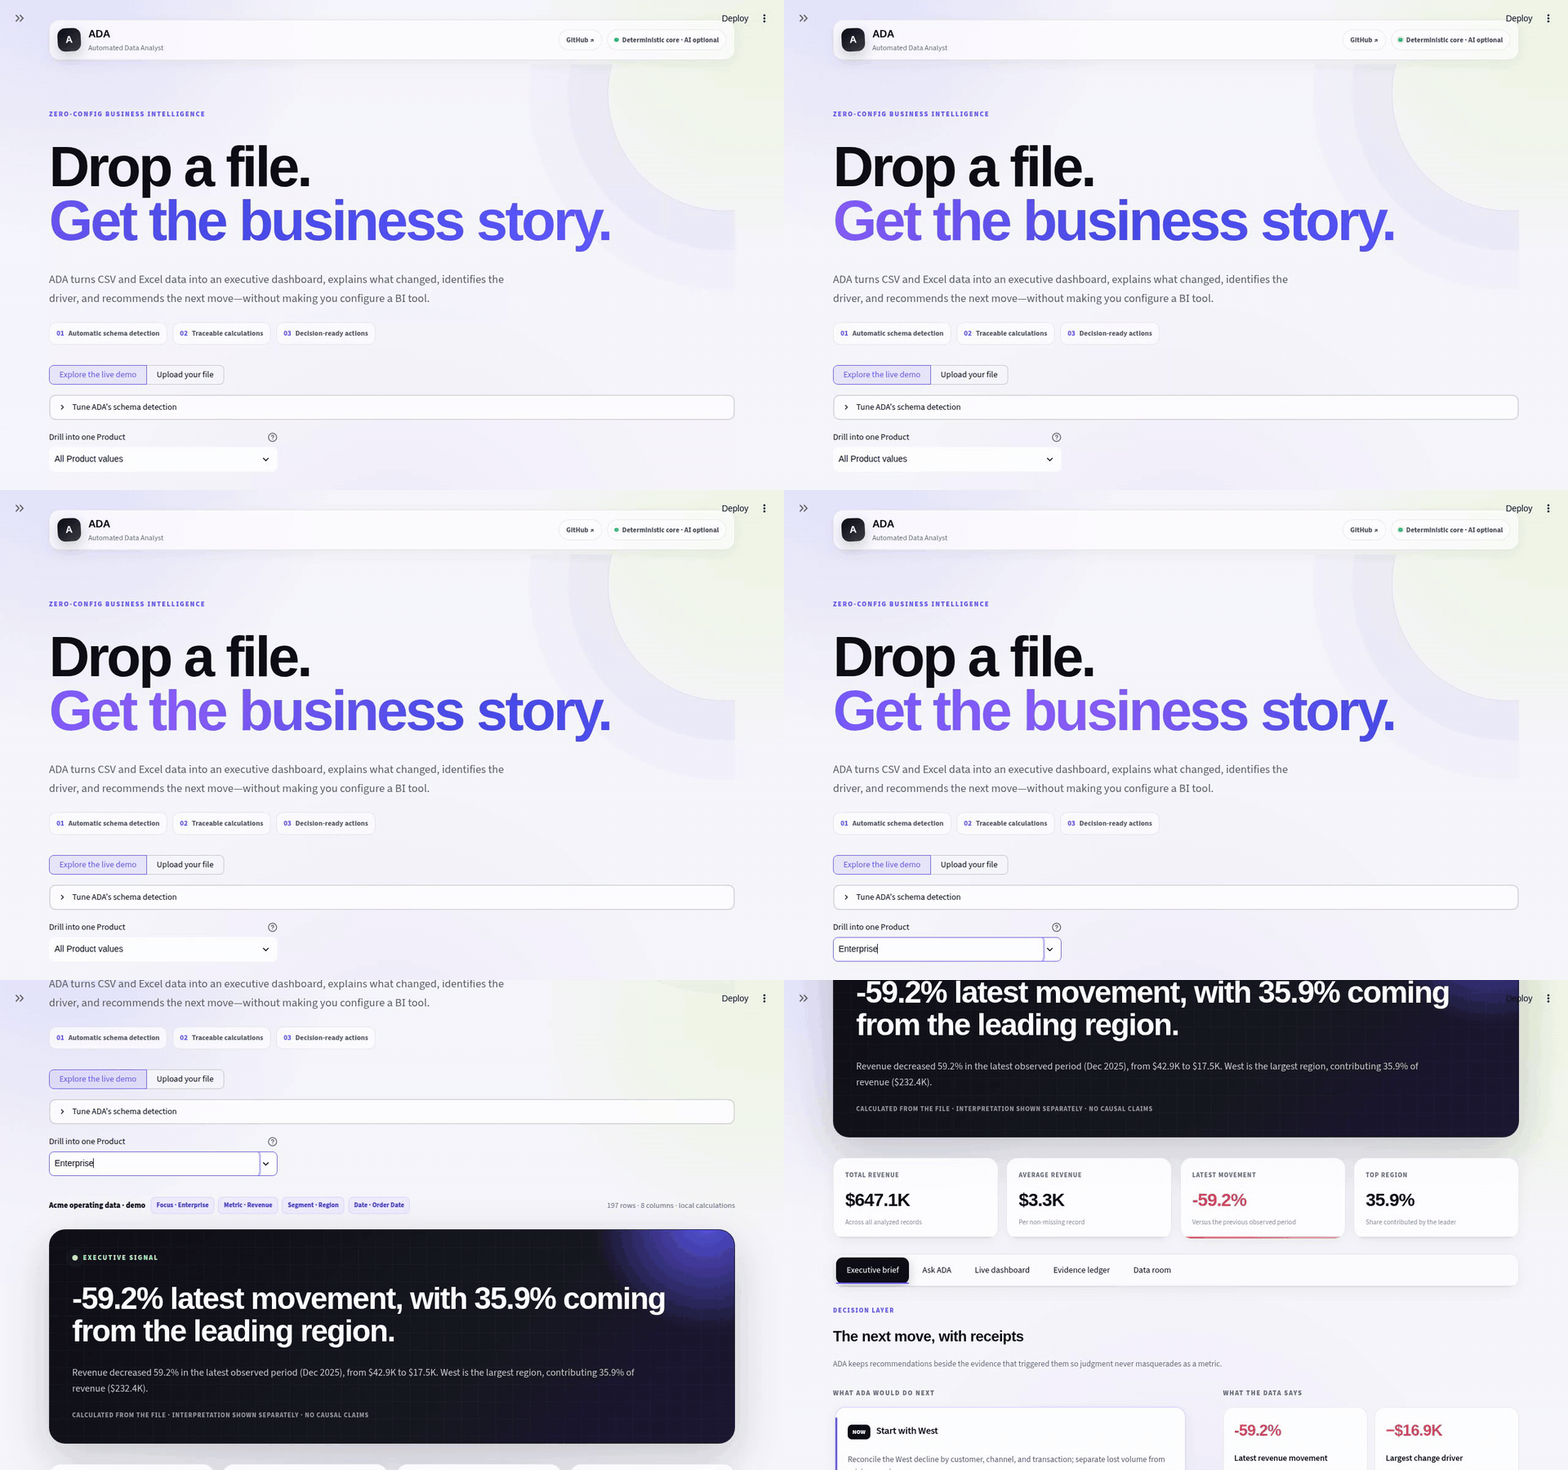
Focus on one segment. The whole analysis regroups.
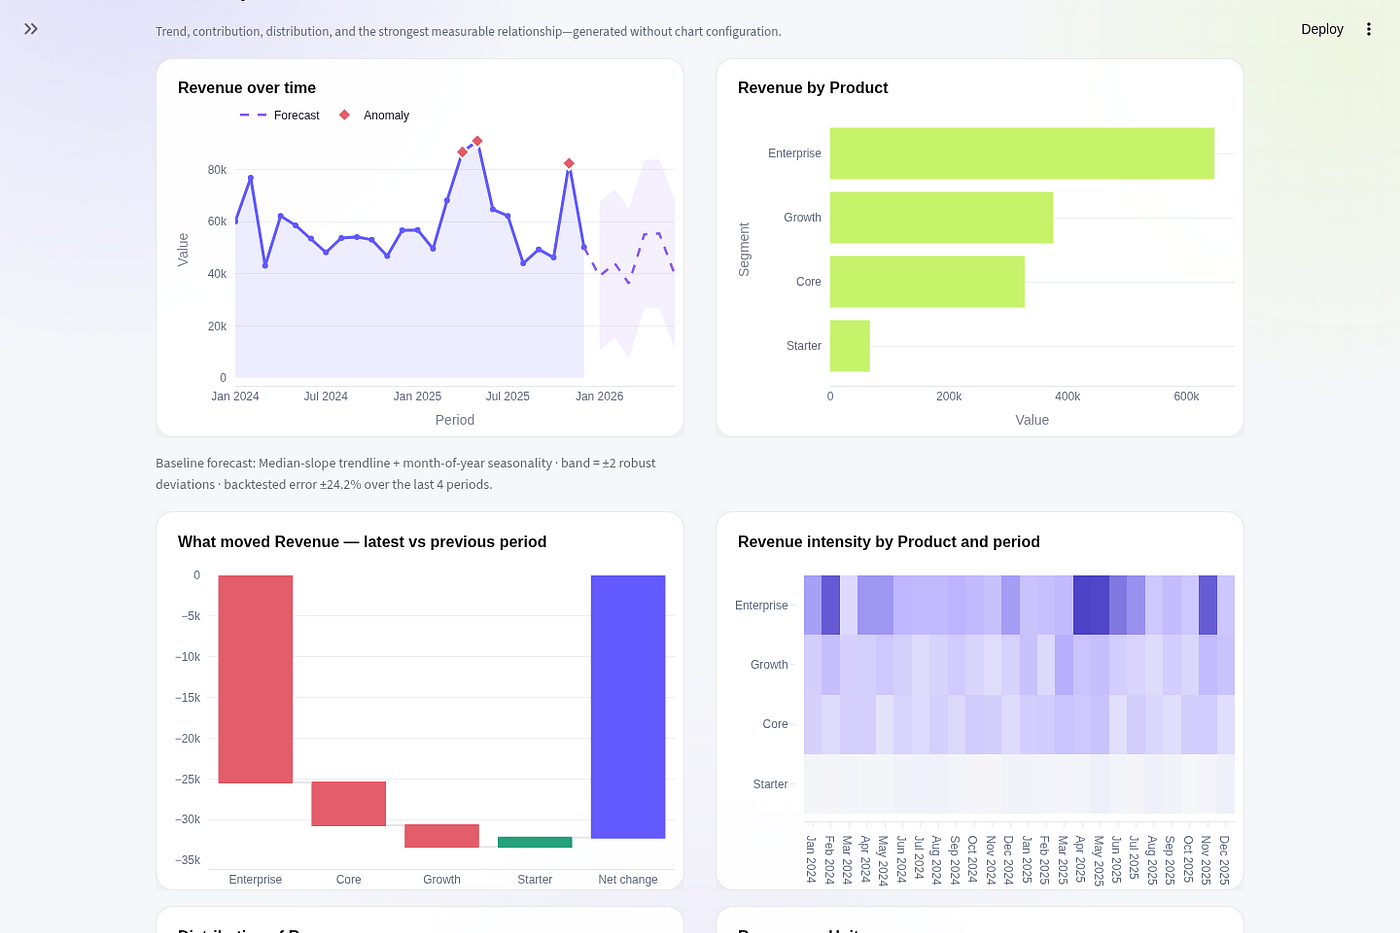
Run it
git clone https://github.com/saineshnakra/automated-data-analyst.git
cd automated-data-analyst
python -m venv .venv
source .venv/bin/activate        # Windows: .venv\Scripts\activate
python -m pip install -r requirements.txt
streamlit run app.py
No API key required. The app opens with a built-in demo dataset.
Does my data leave my machine?
Running ADA yourself: no. Cleaning, schema detection, every chart, and every
Ask ADA answer are computed locally with pandas, with no network call at all.
Using the hosted demo: your file is uploaded to a Streamlit server, because
that is what uploading a file to a website means. It is held in memory for the
session and never written to a database. If that matters for your data, run ADA
locally - it is four commands above and needs no key.
An optional AI layer adds two things when you supply a key: a query planner for
questions the rules cannot parse, and a strategic narrative. The planner shows
its proposed calculation and waits for your confirmation before ADA executes it
locally. Neither ever receives your rows. They receive column names, types,
and already-computed evidence - and because an evidence sentence names the
segment it is about, a segment label such as a customer or product name can
appear in it. Nothing else from a cell does. Model-generated code is never
executed.
Full details: Privacy · SECURITY.md
Documentation
| Page | What you get |
|---|---|
| Concepts | The words ADA uses: measure, segment, period, evidence, plan |
| How it works | Upload to dashboard, step by step |
| Architecture | Which file does what, and why |
| Reference | One page per pipeline step |
| Development | Setup, tests, CI, conventions |
| FAQ | Short answers to common questions |
For the design story behind the project, read
I Built an AI Data Analyst That Tells You When It Hallucinates.
Building on ADA?
A link back to this repo is appreciated. If you've shipped something with it,
open an issue and I'll list it here.
ADA is MIT licensed, so you are free to use, change and ship it - commercially
too. The only thing the licence asks is that the copyright notice travels with
the code.
Built with ADA
- Yours could be here.
FAQ
Common questions
Discussion
Questions & comments · 0
Sign In Sign in to leave a comment.